> ## Documentation Index
> Fetch the complete documentation index at: https://docs.cura.so/llms.txt
> Use this file to discover all available pages before exploring further.
# Key metrics explained (response time, conversion, bookings)
> Your Reports page is full of numbers — but a handful of them tell you most of what you need to know.
Your Reports page is full of numbers — but a handful of them tell you most of what you need to know. This article explains the key metrics in plain language, so you know exactly what each one means and why it matters.
Use it as a reference: come back whenever a number on your Reports page makes you ask, "wait, what does that actually measure?"
***
## Response time
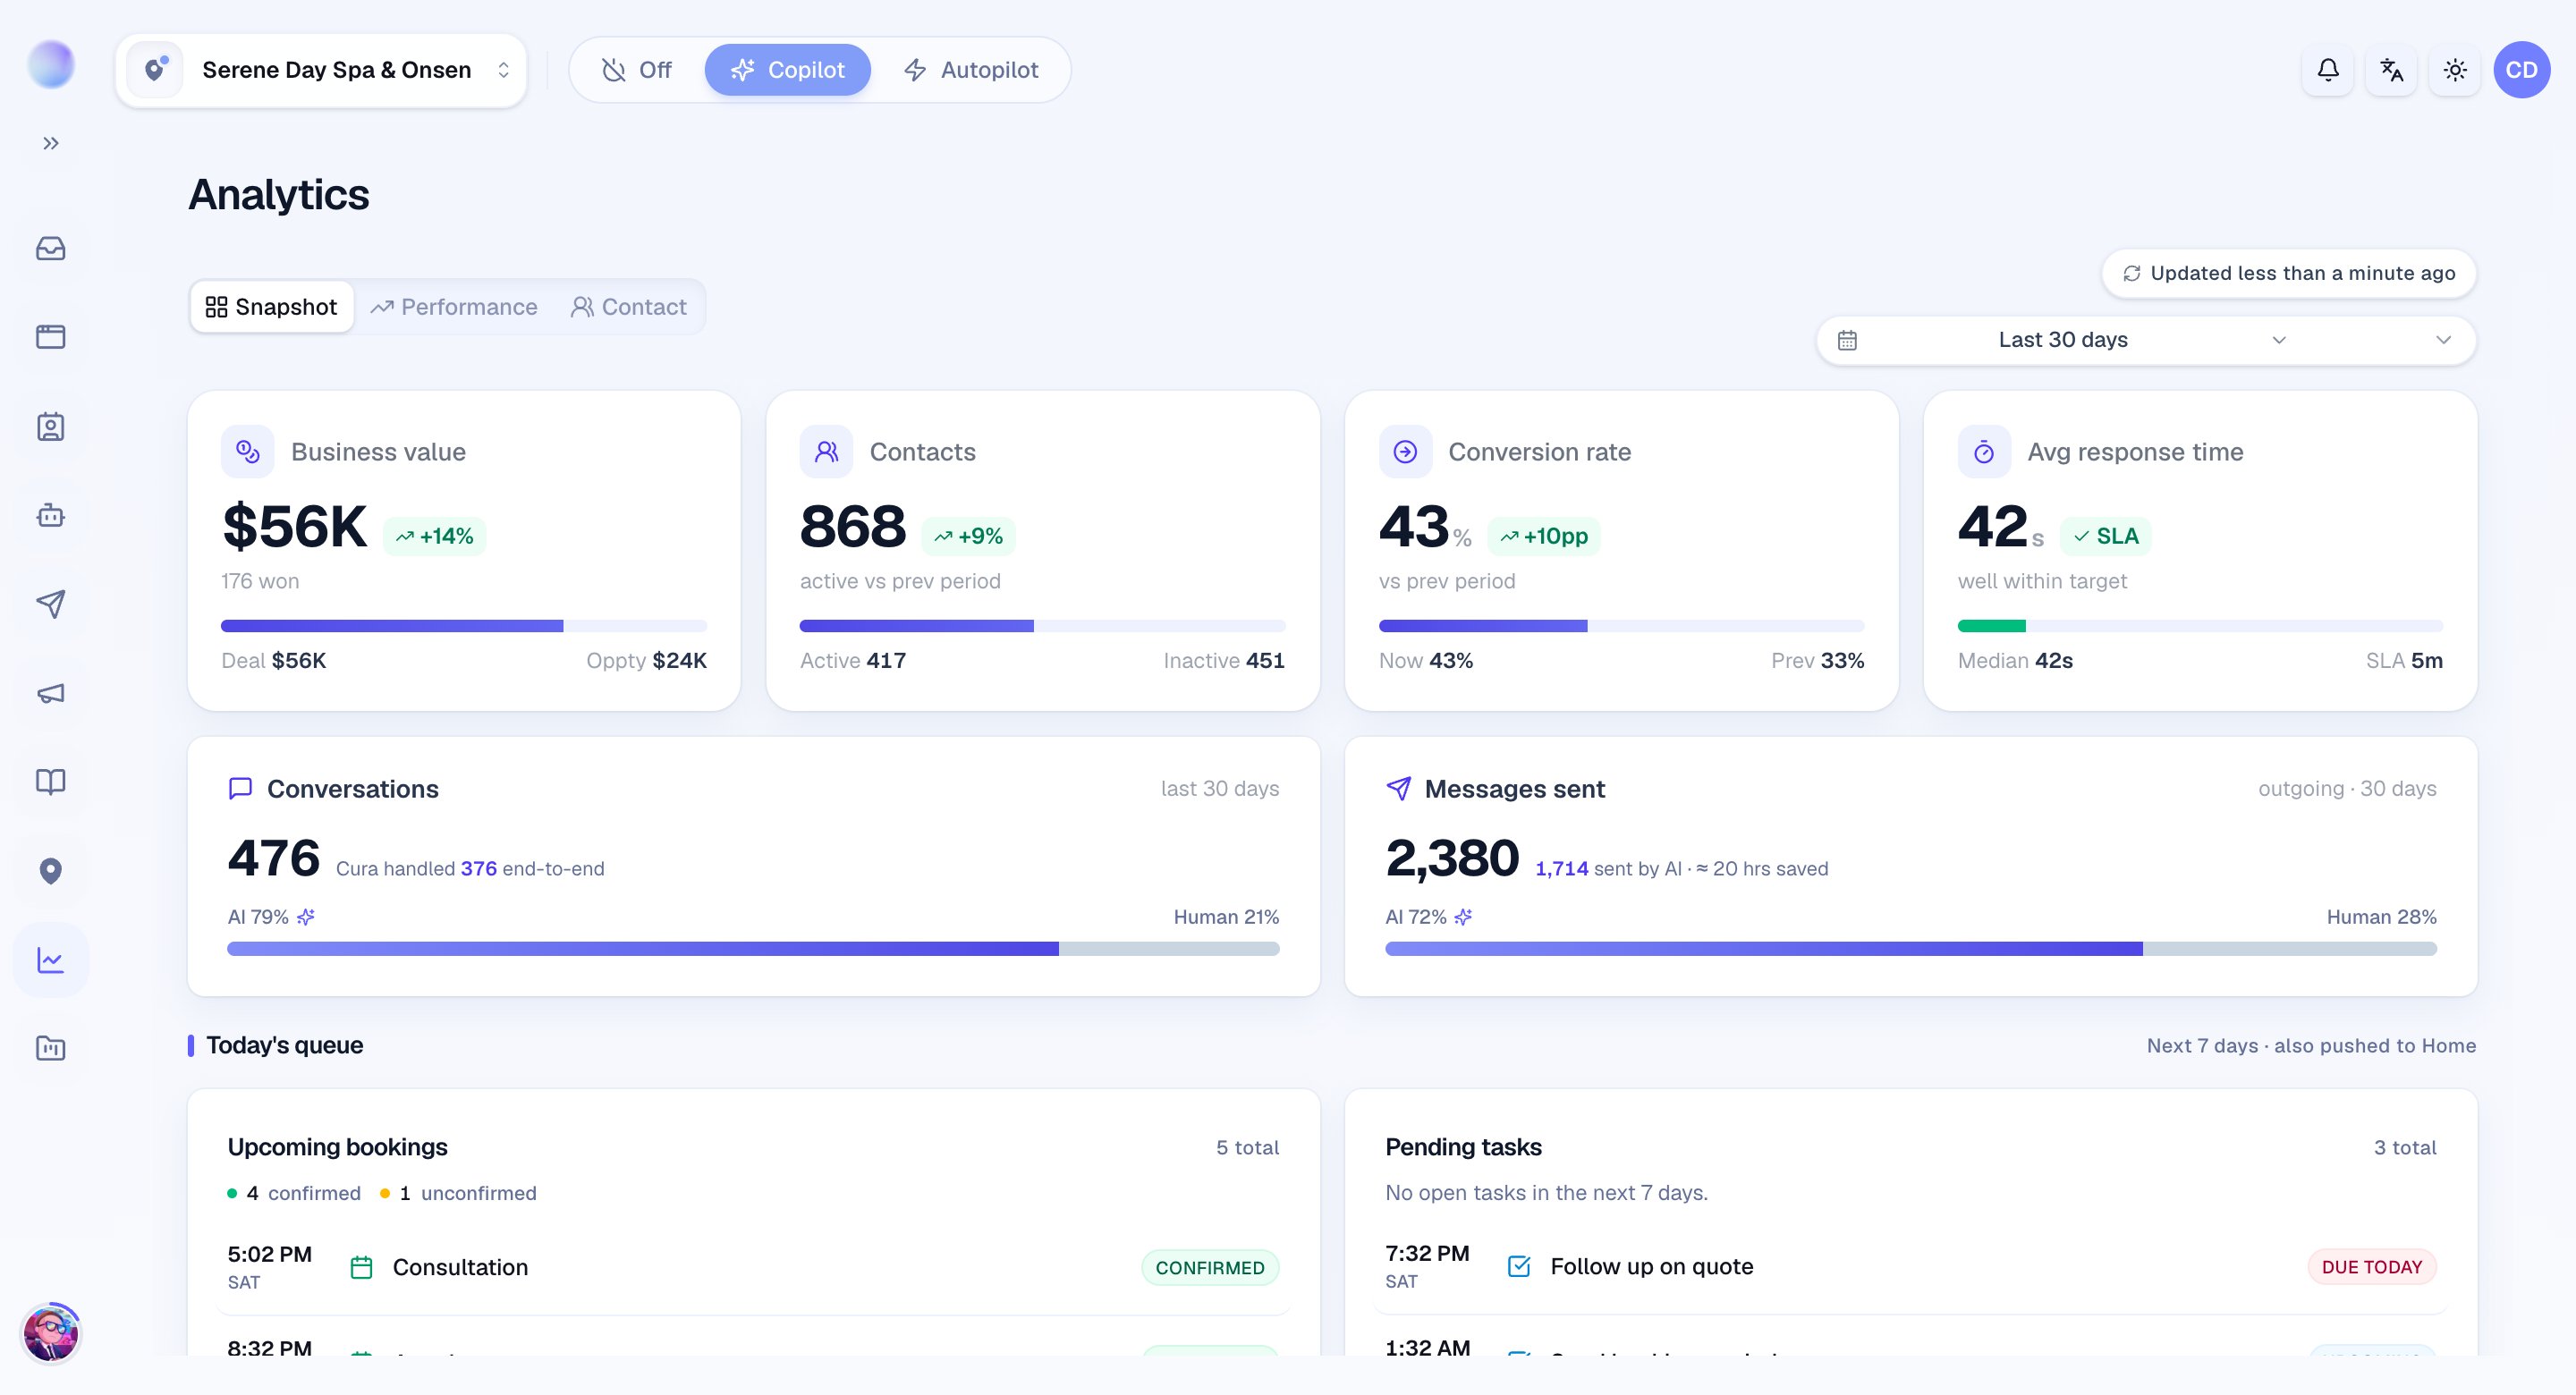
**What it measures:** the **average** time a customer waits for their first reply after they message you. For each conversation, Cura measures the gap between the customer's first message and the first reply back — whether that reply came from your AI or a person — then averages those gaps across the period. The headline figure is the mean, not the median.
For service businesses, speed wins bookings. A fast first response keeps customers from drifting to a competitor while they wait. Watch this number trend down over time, and watch for spikes during your busiest hours.
The **Response Time** card goes deeper than the average. It also shows the **median, p90, and p95** (so one very slow reply doesn't hide the typical experience), an **SLA-compliance percentage** measured against a 5-minute target, a distribution of how fast replies land, daily trends, and a per-channel breakdown.
 ## Conversion to booking
**What it measures:** the share of conversations that turn into a booking, shown as a percentage. Cura divides the number of bookings created in the period by the total number of conversations in that same period.
This is your messaging-to-money metric. If you have 100 conversations and 30 bookings, that's a 30% conversion rate. A rising rate means your AI and your team are turning interest into appointments; a falling rate is a cue to look at *where* conversations stall — pricing questions, slow replies, or unanswered objections.
Want to see exactly where conversations drop off? The **Conversion Funnel** card walks through five stages — Total Conversations, With Agent Sessions, With Booking Attempts, Successful Bookings, and Confirmed Bookings — so you can spot the step that's leaking.
If conversion dips, pair this metric with response time. Slow replies and low conversion often go hand in hand, and improving one usually lifts the other.
## Bookings
**What it measures:** the appointments created over the selected period.
Bookings is the outcome you're ultimately after. Reports shows how bookings trend day to day and helps you spot your busiest booking windows — useful for planning staff and promotions.
## Revenue generated
**What it measures:** an **estimate** of the revenue tied to your bookings.
Cura doesn't track the real price of each appointment, so this figure is a simple stand-in: it multiplies the number of bookings in the period by a flat **\$50 per booking**. Treat it as a rough directional signal that moves with your booking volume — not as your actual takings.
Revenue generated is an estimate, not real money. Because every booking is valued at the same flat \$50, the number reflects how many appointments you booked, not what they were actually worth.
## Message and conversation volume
**What it measures:** how many messages and conversations flowed through Cura in the period.
Volume is your demand signal. Rising volume means more people are reaching out; comparing it against bookings and response time tells you whether you're keeping up as you grow.
## AI vs. human handling
**What it measures:** the raw counts of messages sent by **your AI** versus by a **person** on your team, alongside how many conversations are currently handled by AI, by a human, or are unassigned. You'll find these in the **Messaging Activity** and **Total Conversations** headline cards.
This shows how much load your AI is carrying. A high share of AI-sent messages means your team is freed up for the conversations that truly need a human touch — and it's a good indicator of how well your Knowledge Base is trained.
Every metric respects the **time period** and **workspace** filters at the top of Reports. Two numbers will only match if they're measured over the same window and the same workspace scope.
***
### Related articles
* [Reports overview](/reports/reports-overview)
* [Refreshing and exporting report data](/reports/refreshing-and-exporting)
## Conversion to booking
**What it measures:** the share of conversations that turn into a booking, shown as a percentage. Cura divides the number of bookings created in the period by the total number of conversations in that same period.
This is your messaging-to-money metric. If you have 100 conversations and 30 bookings, that's a 30% conversion rate. A rising rate means your AI and your team are turning interest into appointments; a falling rate is a cue to look at *where* conversations stall — pricing questions, slow replies, or unanswered objections.
Want to see exactly where conversations drop off? The **Conversion Funnel** card walks through five stages — Total Conversations, With Agent Sessions, With Booking Attempts, Successful Bookings, and Confirmed Bookings — so you can spot the step that's leaking.
If conversion dips, pair this metric with response time. Slow replies and low conversion often go hand in hand, and improving one usually lifts the other.
## Bookings
**What it measures:** the appointments created over the selected period.
Bookings is the outcome you're ultimately after. Reports shows how bookings trend day to day and helps you spot your busiest booking windows — useful for planning staff and promotions.
## Revenue generated
**What it measures:** an **estimate** of the revenue tied to your bookings.
Cura doesn't track the real price of each appointment, so this figure is a simple stand-in: it multiplies the number of bookings in the period by a flat **\$50 per booking**. Treat it as a rough directional signal that moves with your booking volume — not as your actual takings.
Revenue generated is an estimate, not real money. Because every booking is valued at the same flat \$50, the number reflects how many appointments you booked, not what they were actually worth.
## Message and conversation volume
**What it measures:** how many messages and conversations flowed through Cura in the period.
Volume is your demand signal. Rising volume means more people are reaching out; comparing it against bookings and response time tells you whether you're keeping up as you grow.
## AI vs. human handling
**What it measures:** the raw counts of messages sent by **your AI** versus by a **person** on your team, alongside how many conversations are currently handled by AI, by a human, or are unassigned. You'll find these in the **Messaging Activity** and **Total Conversations** headline cards.
This shows how much load your AI is carrying. A high share of AI-sent messages means your team is freed up for the conversations that truly need a human touch — and it's a good indicator of how well your Knowledge Base is trained.
Every metric respects the **time period** and **workspace** filters at the top of Reports. Two numbers will only match if they're measured over the same window and the same workspace scope.
***
### Related articles
* [Reports overview](/reports/reports-overview)
* [Refreshing and exporting report data](/reports/refreshing-and-exporting)