

One screen, the whole picture
Reports gathers your performance into a single page you scroll through. At the top sit two headline cards — Total Conversations (with an AI, human, and unassigned breakdown) and Messaging Activity (your total message volume, split into incoming, AI-sent, and user-sent). Below them, a series of chart cards break down conversations, channels, bookings, response time, and team activity over the period you choose.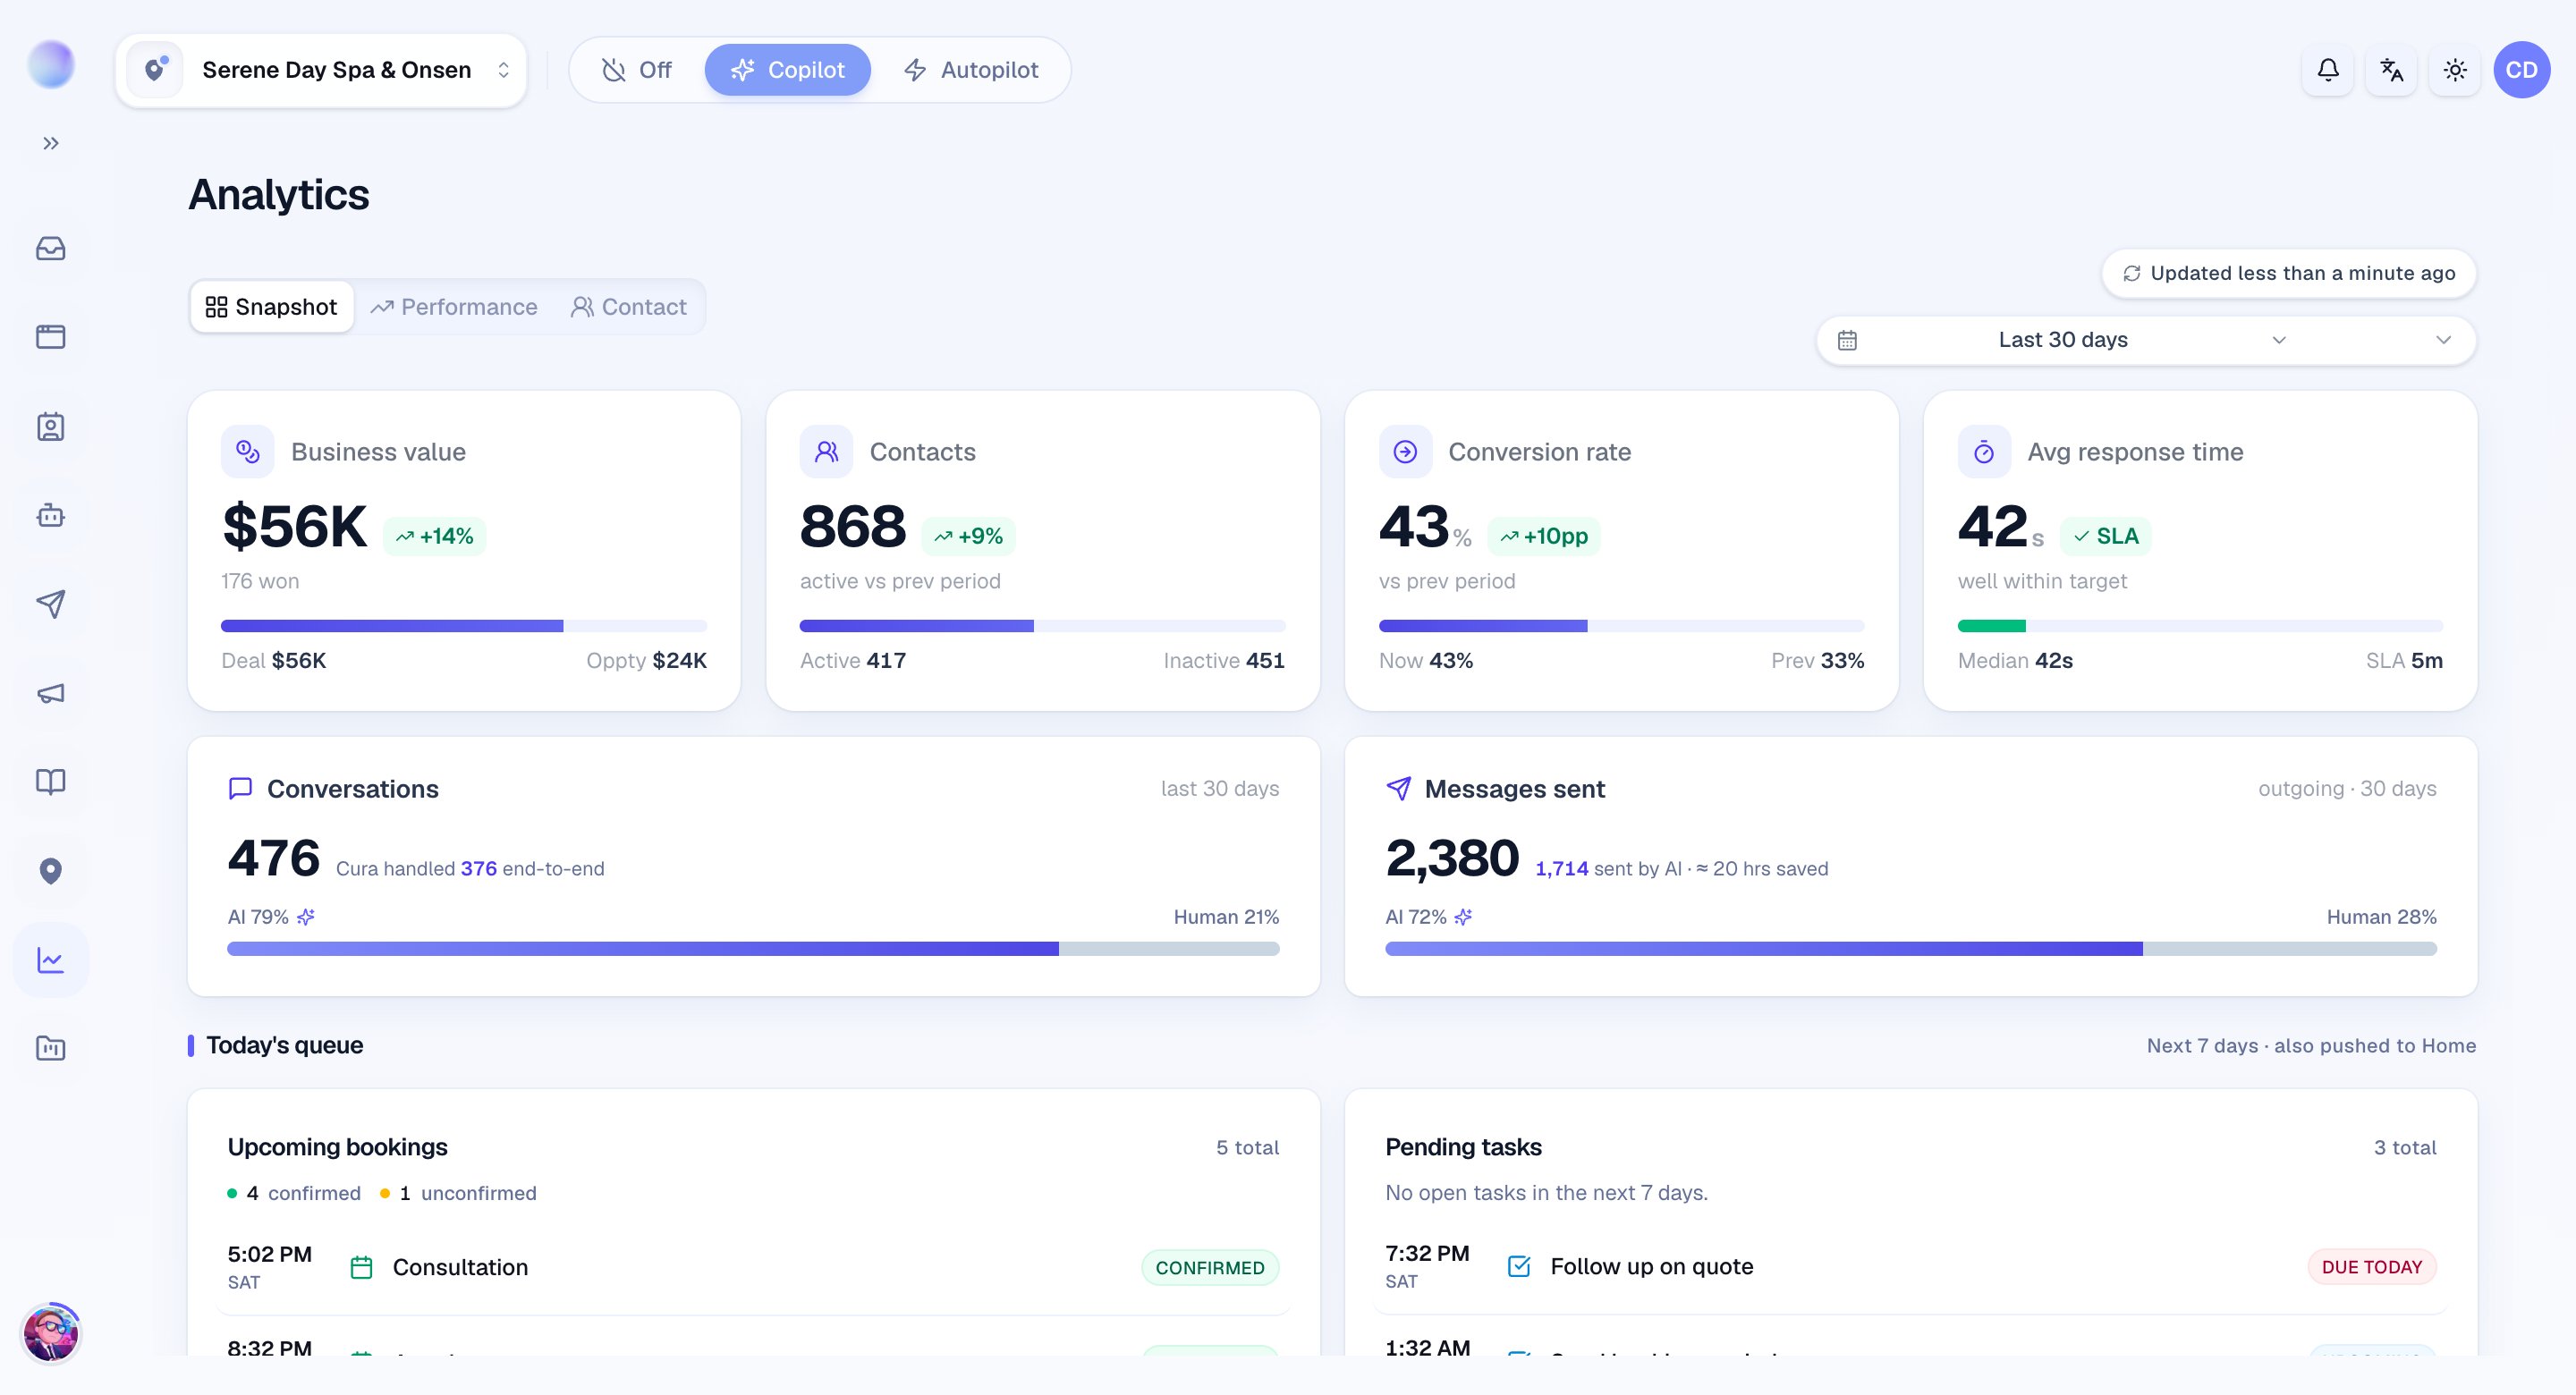
Reports is for people who manage the business. Only account admins and workspace managers can open it — team members won’t see Reports in their navigation.
Choose your time period
A time period selector sits at the top of Reports. Pick a recent window — the last 7, 14, 30, or 90 days — or choose Custom range to look at a specific stretch, like a campaign or a holiday week. Custom ranges can cover up to 90 days, and future dates aren’t selectable. Every chart and number on the page updates to match.Focus on one workspace — or see everything
If your business has more than one location or brand, the workspace filter lets you scope the report to a single workspace, view all workspaces together, or look at unassigned activity. This makes it easy to compare branches or zoom in on the one you’re worried about.What Reports measures
The chart cards are grouped around the things that move your business:- Conversation trends and status — how many conversations you’re handling, and how they break down by open, snoozed, and resolved.
- Response time — how quickly customers get a first reply.
- Bookings — booking trends and the busiest hours and days of the week.
- Conversion funnel — how conversations move from first contact through to a confirmed booking.
- AI vs. human handling — how much your AI manages on its own versus what your team steps in for.
- Channel and agent performance — which channels bring the most activity, and how your agents are doing.
- Contact growth and priority — how your contact list is growing and how conversations are prioritized.
Reports is built on a daily snapshot of your data, so the numbers are fast and consistent. If you’ve just made changes and want the very latest, use Refresh Now — see Refreshing and exporting report data.